Color usage
The following three images represent the color usage for the countys flag. Which european countries are shown here?
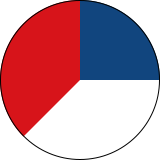 |
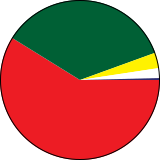 |
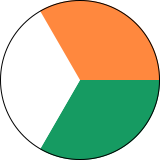 |
These kind of images work well with flags, heraldics or other images that are schematic and use a small color palette only. It's not suitable for photographic images. The flags above use three or some more colors, but generally not many.
Another aspect to count colors, is to have a good quality of the original image. A picture taken of a flag in bright daylight still contains a lot of colors, mainly nuances of the unique color of the flag, because of different light reflection, shadow and other obstacles.
The best results (that were also used for the quiz above) are e.g flags from Wikipedia in the SVG format. While SVG cannot be used by the script, these can be easily converted into PNG images.
Convert the SVG into a PNG
Spoiler: if you still are guessing which countries are behind the images above try to solve the question first, before reading further.
In order to create the quiz above, I downloaded the flag images as SVG from the German Wikipedia.
I use Image Magick to convert the SVG into a PNG. The easiest way is:
magick flag.svg flag.png
To get the number of unique colors used in the PNG the following commands can be used:
$: identify -unique flag.png
flag.png PNG 900x600 900x600+0+0 4-bit Palette sRGB 11c 3431B 0.000u 0:00.004

$: identify -format %k flag.png
11

$: magick flag.png -unique-colors txt:-
# ImageMagick pixel enumeration: 11,1,0,255,srgb
0,0: (83,53,93)  #53355D  srgb(83,53,93)
1,0: (17,69,126)  #11457E  srgb(17,69,126)
2,0: (34,65,118)  #224176  srgb(34,65,118)
3,0: (149,36,59)  #95243B  srgb(149,36,59)
4,0: (215,20,26)  #D7141A  srgb(215,20,26)
5,0: (198,24,34)  #C61822  srgb(198,24,34)
6,0: (33,81,135)  #215187  srgb(33,81,135)
7,0: (88,124,164)  #587CA4  srgb(88,124,164)
8,0: (160,181,203)  #A0B5CB  srgb(160,181,203)
9,0: (231,236,242)  #E7ECF2  srgb(231,236,242)
10,0: (255,255,255)  #FFFFFF  white
This image uses 11 colors. It should use 3 only, white, blue, and red. To get a cleaner result of the SVG to PNG conversion we can use:
magick flag.svg -colors 3 flag.png
Checking the colors again reveals that there are 3 only. Here we limit the number of colors
with the argument -colors. This works well when you know exactly how many colors are used.
Flags of Belgium, Germany or Switzerland are suitable, because they have simple plain colors.
Flags that contain a heraldic, such as the second question in the quiz above, makes it more
difficult.
Quantify colors and pixels
To actually count the used colors in an image, we count all the pixels and group them by the color value of that pixel. This is exactly what the Python script does:
#!/usr/bin/env python3
# -*- coding: UTF-8 -*-

"""
This script reads an image file, for each pixel reads the color and counts
all pixels with the same color and creates a ranking. The list is then used
to create a stacked bar chart with the used colors. Each bar gets the width
in percentage of the amount used in the original file.

The script makes sense for schematic images with a small colors palette only.
Real photograhic images are not suited.

Usage: used-colors.py [options] <infile> [<outfile>]

Arguments:
<infile>        The image file that is analyzed.
<outfile>       The optional file where the SVG output is written to. When
                not set the SVG is written to stdout.
--alpha <int>   Pixels with an alpha value at or below this threshold (0-255)
                are treated as transparent and ignored. Default is 0, which
                drops only fully transparent pixels. Raise it to also discard
                faint anti-aliased edge pixels.
--border <str>  The color and width of the border around the SVG. Default is
                none. A border can be defined as <color>:<width> e.g. #000000:2
                for a black border with width 2. The color can be provided as
                a hex number e.g. #ffffff or as 255,255,255 for white.
--dim <WxH>|<R> The dimension of the resulting SVG. Default is 200x300. When
                the width is larger as the height, vertical bars are drawn,
                otherwise horizintal bars are drawn.
                If only one value is provided, a pie chart is drawn with the
                given radius.
--dump          Output the list of colors and occurrence, no SVG is written.
--help          Print this help screen.
--ignore <str>  Ignore a color (e.g. the background color from anaylzing).
                The color can be provided as a hex number e.g. #ffffff or
                (255, 255, 255) for white.
--num <int>     The number of the most used colors is considered only.
                Default is 10.
"""

from PIL import Image
from collections import Counter
import math, os, re, sys


def dieNice(errMsg: str):
    """
    Die nice with an error message and return exit code 1.
    """
    print(f"Error: {errMsg}\nSee --help for more details.")
    sys.exit(1)

def colorFromArg(arg: str):
    """
    Convert a color argument to an RGB tuple. The color can
    be provided as a hex number e.g. #ffffff or as 255,255,255 for white.
    """

    if arg[0:1] == '#':
        color = tuple(int(arg[i:i+2], 16) for i in (1, 3, 5))
    else:
        color = tuple(map(int, re.sub(r"[^\d\,]", '', arg).split(',')))
        if len(color) != 3:
            raise ValueError
    for c in color:
        if c < 0 or c > 255:
            raise ValueError
    return color

def rgba2rgb(rgba, background=(255, 255, 255)):
    """
    Convert an RGBA color to RGB by compositing it onto a background color.
    The background color is provided as an RGB tuple.
    """
    if not rgba:
        return rgba
    channels = len(rgba)

    if channels == 3:
        return rgba

    assert channels == 4, "RGBA image must have 4 channels."

    r, g, b, a = rgba
    alpha = a / 255.0
    R, G, B = background
    return (
        int(r * alpha + (1 - alpha) * R),
        int(g * alpha + (1 - alpha) * G),
        int(b * alpha + (1 - alpha) * B),
    )

def getUsedColors(file: str, numColors: int, **kwargs):
    """
    Get an associative array of colors and their proportions from an image file.
    The key is the RGB color as a string "R,G,B", and the value is the proportion
    of that color in the image.
    Every pixel is counted at the image's native resolution (no downscaling / interpolation,
    so no colors are invented and no counts are smeared across neighbours), and transparency is
    decided per pixel from the alpha channel. Pixels whose alpha is at or below
    $alphaThreshold are dropped; the rest are composited onto $bgColor.
    """
    # Load image as RGBA so transparency lives in the alpha channel.
    img = Image.open(file).convert("RGBA")

    bgColor = kwargs.get('bgColor', (255, 255, 255)) # Default background color (white)
    # Pixels with alpha at or below this value are treated as transparent and
    # dropped. Default 0 = drop only fully transparent pixels.
    alphaThreshold = kwargs.get('alphaThreshold', 0)

    # Decide transparency per pixel via its alpha value, never by guessing a
    # single "transparent color" (an RGBA image does not have one). Drop the
    # transparent pixels, then composite the rest onto the background.
    colorCounts = Counter(
        rgba2rgb(p, background=bgColor)
        for p in img.get_flattened_data()
        if p[3] > alphaThreshold
    )

    # Remove the color to ignore.
    ignore = kwargs.get('ignore')
    if ignore is not None:
        del colorCounts[ignore]

    # Sort by most used colors.
    sortedColors = sorted(colorCounts.items(), key=lambda x: x[1], reverse=True)

    # Keep only the top $numColors colors and drop the rest lesser used colors.
    if numColors < len(sortedColors):
        sortedColors = sortedColors[0:numColors]

    # Total pixels, needed to convert counts to proportions (but do not count pixels
    # used the dropped colors).
    total = 0
    for color in sortedColors:
        total += color[1]

    # Convert to proportions.
    for key, item in enumerate(sortedColors):
        sortedColors[key] = (item[0], item[1] / total)

    return sortedColors

def writeBarSvg(width: int, height: int, colors: list, borderColor: int = None, borderWidth: int = 0) -> str:
    """
    Write a bar chart as SVG. Input is the width and height and a list of colors (r, g, b) and their proportions (0-1).
    Also a border color and width can be defined. The result is the SVG as a string.
    """

    svgParts = []
    svgParts.append(f'<svg xmlns="http://www.w3.org/2000/svg" width="{width}" height="{height}">')

    offset = 0

    for (r, g, b), count in colors:
        if (width < height):
            barPart = float(count) * height
            svgParts.append(
                f'<rect x="0" y="{offset}" width="{width}" height="{barPart}" '
                f'fill="rgb({r},{g},{b})" />'
            )
            offset += barPart
        else:
            barPart = float(count) * width
            svgParts.append(
                f'<rect x="{offset}" y="0" width="{barPart}" height="{height}" '
                f'fill="rgb({r},{g},{b})" />'
            )
            offset += barPart

    # Add border if specified
    if borderColor is not None:
        fillStr = f'rgb({borderColor[0]},{borderColor[1]},{borderColor[2]})'
        svgParts.append(
            f'<rect x="0" y="0" width="{width}" height="{borderWidth}" fill="{fillStr}" />'
        )
        svgParts.append(
            f'<rect x="0" y="{height - borderWidth}" width="{width}" height="{borderWidth}" fill="{fillStr}" />'
        )
        svgParts.append(
            f'<rect x="0" y="0" width="{borderWidth}" height="{height}" fill="{fillStr}" />'
        )
        svgParts.append(
            f'<rect x="{width - borderWidth}" y="0" width="{borderWidth}" height="{height}" fill="{fillStr}" />'
        )

    svgParts.append('</svg>')

    return "\n".join(svgParts)

def writePieSvg(radius: int, colors: list, borderColor: int = None, borderWidth: int = 0) -> str:
    """
    Write a pie chart as SVG. Input is the radius and a list of colors (r, g, b) and their proportions (0-1).
    Also a border color and width can be defined. The result is the SVG as a string.
    """

    svgParts = []
    svgParts.append(f'<svg xmlns="http://www.w3.org/2000/svg" width="{radius*2}" height="{radius*2}">')

    cx, cy = radius, radius
    startAngle = 0

    for (r, g, b), count in colors:
        endAngle = startAngle + count * 360
        largeArcFlag = 1 if endAngle - startAngle > 180 else 0

        x1 = cx + radius * math.cos(math.radians(startAngle))
        y1 = cy + radius * math.sin(math.radians(startAngle))
        x2 = cx + radius * math.cos(math.radians(endAngle))
        y2 = cy + radius * math.sin(math.radians(endAngle))

        pathData = f'M {cx},{cy} L {x1},{y1} A {radius},{radius} 0 {largeArcFlag},1 {x2},{y2} Z'
        svgParts.append(f'<path d="{pathData}" fill="rgb({r},{g},{b})" />')

        startAngle = endAngle

    # Add border if specified
    if borderColor is not None and borderWidth > 0:
        fillStr = f'rgb({borderColor[0]},{borderColor[1]},{borderColor[2]})'
        radius = radius - borderWidth / 2
        svgParts.append(
            f'<circle cx="{cx}" cy="{cy}" r="{radius}" fill="none" stroke="{fillStr}" stroke-width="{borderWidth}" />'
        )

    svgParts.append('</svg>')

    return "\n".join(svgParts)

def main():
    """Evaluate command line arguments, build up worklog and start
    processing the wiki articles"""

    # available options that can be changed via the command line
    options = ['ignore', 'num', 'dim', 'help', 'dump', 'border', 'bgcolor', 'alpha']
    inFile = ''
    outFile = ''
    numColors = 10
    dim = []
    dump = False
    ignore = None
    borderColor = None
    borderWidth = 0
    bgColor = (255, 255, 255)
    alphaThreshold = 0

    # try to fetch the command line args
    currentCmd = ''
    for i in range(len(sys.argv)):
        if i == 0:
            continue
        arg = sys.argv[i]
        # we have a command identified by -- remember it in currentCmd
        # in case this command needs an argument, or just set the
        # appropriate parameter in the worklog or execute some action
        if arg[0:2] == '--':
            currentCmd = arg[2:]
            if not(currentCmd in options):
                dieNice("Invalid argument %s" % currentCmd)
            if currentCmd == 'help':
                print(__doc__)
                sys.exit(0)
            if currentCmd == 'dump':
                dump = True
                currentCmd = ''
        # we have an argument, what was the previous command, do this
        # action in the worklog.
        elif len(currentCmd) > 0:
            if currentCmd == 'num':
                try:
                    numColors = int(arg)
                except:
                    dieNice('Invalid value for --num')
            elif currentCmd == 'alpha':
                try:
                    alphaThreshold = int(arg)
                    if alphaThreshold < 0 or alphaThreshold > 255:
                        raise ValueError
                except:
                    dieNice('Invalid value for --alpha, expected 0-255')
            elif currentCmd == 'dim':
                try:
                    dim = list(map(int, arg.split("x")))
                    if len(dim) < 1 or len(dim) > 2:
                        raise ValueError
                except:
                    dieNice('dimension value incorrect')
            elif currentCmd == 'border':
                try:
                    borderParts = arg.split(':')
                    if len(borderParts) != 2:
                        raise ValueError
                    borderColor, borderWidth = borderParts
                    borderWidth = int(borderWidth)
                    borderColor = colorFromArg(borderColor)
                except:
                    dieNice('Invalid value for --border')
            elif currentCmd == 'ignore':
                try:
                    ignore = colorFromArg(arg)
                except:
                    dieNice('Invalid value for color to ignore')
            currentCmd = ''
        else:
            # No argument prefix hence it must be a file name.
            if inFile == '':
                inFile = arg if arg[0:1] == '/' else os.getcwd() + '/' + arg
                # Check if current arg is a file that actually exists.
                if not os.path.isfile(inFile):
                    dieNice(f'File {arg} does not exist.')
            elif outFile == '':
                outFile = arg if arg[0:1] == '/' else os.getcwd() + '/' + arg
            else:
                dieNice('Invalid argument')

    if inFile == '':
        dieNice('Image file not given')
    # process the data now
    colors = getUsedColors(inFile, numColors, ignore=ignore, bgColor=bgColor, alphaThreshold=alphaThreshold)

    if dump == True:
        # Print top colors.
        for color, proportion in colors:
            print(color, proportion)
        print(sum(value for _, value in colors))
        sys.exit(0)

    chartFormat = 'bar'
    if len(dim) == 0:
        dim = [200,300]
    elif len(dim) == 1:
        chartFormat = 'pie'

    if outFile == '':
        if chartFormat == 'bar':
            print(writeBarSvg(dim[0], dim[1], colors, borderColor=borderColor, borderWidth=borderWidth))
        else:
            print(writePieSvg(dim[0], colors, borderColor=borderColor, borderWidth=borderWidth))
    else:
        with open(outFile, "w") as f:
            if chartFormat == 'bar':
                f.write(writeBarSvg(dim[0], dim[1], colors, borderColor=borderColor, borderWidth=borderWidth))
            else:
                f.write(writePieSvg(dim[0], colors, borderColor=borderColor, borderWidth=borderWidth))

if __name__ == "__main__":
    main()
The script can display a color usage similar to the output of the Image Magick command from above:
$: ./used-colors.py cz2.png --dump
(255, 255, 255) 0.37454848569046956
(215, 20, 26) 0.37454848569046956
(17, 69, 126) 0.24895804390108364
(88, 124, 164) 0.0002778549597110308
(231, 236, 242) 0.0002778549597110308
(33, 81, 135) 0.0002778549597110308
(160, 181, 203) 0.0002778549597110308
(34, 65, 118) 0.0002778549597110308
(149, 36, 59) 0.0002778549597110308
(83, 53, 93) 0.0002778549597110308
1.0
Here, the list is sorted by the amount of pixels found for each color. The percentage is displayed as a float between 0 and 1. Again, here we see that there is some image noice, because all colors except the first three are in promille amounts and can be omitted.
To actually create the pie chart, we use the following command:
$: ./used-colors.py flag.png --dim 80 --num 3 --border "#000000:1" q1.svg
The q1.svg is exactly the image that you see above.
The script contains a flag --num to limit the considered colors for counting to
that number. In the above example the first 3 most used colors are counted, and
then the percentage is calculated on these three colors only, making the quantity
of these three colors a 100%.
The script also deals with a background color or transparent color. This is required when the image is not a rectangle that can be cut exactly but from a different shape (such as these pie charts). The whole image canvas is still rectangle where the background color must not be considered for counting.
PHP Version
On the tools section the Used colors application provides the same funtionality online.
<?php

if (!isset($_FILES['file']) || $_FILES['file']['error'] !== UPLOAD_ERR_OK) {
    dieNice("No file uploaded or upload error");
}

$mode = key_exists('mode', $_POST) && $_POST['mode'] === "pie" ? "pie" : "bar";
$width = key_exists('width', $_POST) ? (int)$_POST['width'] : 200;
$height = key_exists('height', $_POST) ? (int)$_POST['height'] : 300;
$radius = key_exists('radius', $_POST) ? (int)$_POST['radius'] : 150;
$borderColor = key_exists('borderColor', $_POST) ? $_POST['borderColor'] : '';
$borderWidth = key_exists('borderWidth', $_POST) ? (int)$_POST['borderWidth'] : 0;
$ignoreColor = key_exists('ignoreColor', $_POST) ? $_POST['ignoreColor'] : '';
$maxColors = key_exists('maxColors', $_POST) ? (int)$_POST['maxColors'] : 10;
$alphaThreshold = key_exists('alpha', $_POST) ? (int)$_POST['alpha'] : 0;
$bgColor = key_exists('bgColor', $_POST) && $_POST['bgColor'] !== '' ? parseColor($_POST['bgColor']) : [255, 255, 255];
$dump = isset($_POST['dumpInfo']) && $_POST['dumpInfo'] === "1";
$infile = $_FILES['file']['tmp_name'];

$colors = countColors($infile, $maxColors, $ignoreColor, $bgColor, $alphaThreshold);

if ($dump) {
    header("Content-Type: application/json");
    $out = [];
    foreach ($colors as $c) {
        $out[] = [
            "rgb" => $c[0],
            "proportion" => $c[1]
        ];
    }
    echo json_encode($out, JSON_PRETTY_PRINT);
    exit;
}

$output = $mode === "pie" ?
    writePieSvg($colors, $radius, $borderColor ? parseColor($borderColor) : null, $borderWidth) :
    writeBarSvg($colors, $width, $height, $borderColor ? parseColor($borderColor) : null, $borderWidth);

if (!empty($output) && strpos($output, '<svg') !== false) {
    header('Content-Type: image/svg+xml');
    echo $output;
    exit;
}
header('HTTP/1.0 400 Bad request');


/* ---------- Helpers ---------- */

/**
 * Send a 400 Bad Request response with a custom message and exit the script.
 *
 * @param string $msg The error message.
 */
function dieNice(string $msg) {
    header('HTTP/1.0 400 ' . $msg);
    echo "Error: $msg\n";
    exit;
}

/**
 * Parse a color string in the format "#RRGGBB" or "R,G,B" into an array of RGB values.
 *
 * @param string $str The color string to parse.
 * @return array An array of RGB values [R, G, B].
 */
function parseColor(string $str) {
    $str = trim($str);

    if (preg_match('/^#([0-9a-fA-F]{6})$/', $str, $m)) {
        return [
            hexdec(substr($m[1], 0, 2)),
            hexdec(substr($m[1], 2, 2)),
            hexdec(substr($m[1], 4, 2))
        ];
    }
    if (preg_match('/^(\d{1,3}),(\d{1,3}),(\d{1,3})$/', $str, $m)) {
        return [(int)$m[1], (int)$m[2], (int)$m[3]];
    }

    dieNice("Invalid color format: $str");
}


/**
 * Get an associative array of colors and their proportions from an image file.
 * The key is the RGB color as a string "R,G,B", and the value is the proportion of that color in the image.
 *
 * Every pixel is counted at the image's native resolution (no downscaling / interpolation,
 * so no colors are invented and no counts are smeared across neighbours), and transparency is
 * decided per pixel from the alpha channel. Pixels whose alpha is at or below $alphaThreshold
 * are dropped; the rest are composited onto $bgColor.
 *
 * @param string $infile Path to the input image file.
 * @param int $numColors Maximum number of colors to return.
 * @param string|null $ignore Optional RGB color to ignore in the format "R,G,B" or "#RRGGBB".
 * @param array $bgColor Background [R, G, B] to composite semi-transparent pixels onto.
 * @param int $alphaThreshold Pixels with alpha (0-255) at or below this are dropped.
 * @return array An array of colors and their proportions.
 */
function countColors(string $infile, int $numColors = 10, ?string $ignore = null, array $bgColor = [255, 255, 255], int $alphaThreshold = 0): array
{
    $info = getimagesize($infile);
    if (!$info) dieNice("Unsupported image");

    $ignoreColor = !empty($ignore) ? parseColor($ignore) : null;

    switch ($info[2]) {
        case IMAGETYPE_PNG:
            $img = imagecreatefrompng($infile);
            break;
        case IMAGETYPE_JPEG:
            $img = imagecreatefromjpeg($infile);
            break;
        case IMAGETYPE_GIF:
            $img = imagecreatefromgif($infile);
            break;
        default:
            dieNice("Only PNG/JPG/GIF supported");
    }
    if (!$img) dieNice("Could not read image");

    // Make sure imagecolorat() returns packed truecolor RGBA values even for
    // palette-based images (GIF / paletted PNG). This conversion is lossless –
    // it does not resample the pixels.
    imagepalettetotruecolor($img);
    // Read the stored alpha channel instead of letting GD flatten it onto a
    // background of its own choosing.
    imagealphablending($img, false);
    imagesavealpha($img, true);

    $w = imagesx($img);
    $h = imagesy($img);

    [$bgR, $bgG, $bgB] = $bgColor;

    $colorCounts = [];

    // Count every pixel at full resolution.
    for ($y = 0; $y < $h; $y++) {
        for ($x = 0; $x < $w; $x++) {
            $rgb = imagecolorat($img, $x, $y);

            // GD packs a 7-bit alpha in bits 24-30 where 0 = fully opaque and
            // 127 = fully transparent. Convert it to the 0-255 convention the
            // Python script uses (0 = transparent, 255 = opaque).
            $gdAlpha = ($rgb >> 24) & 0x7F;
            $a = (int) round((127 - $gdAlpha) * 255 / 127);

            // Drop transparent pixels (alpha at or below the threshold).
            if ($a <= $alphaThreshold) {
                continue;
            }

            $r = ($rgb >> 16) & 0xFF;
            $g = ($rgb >> 8) & 0xFF;
            $b = $rgb & 0xFF;

            // Composite semi-transparent pixels onto the background, matching
            // Python's rgba2rgb() (int() truncates toward zero, like (int) here).
            if ($a < 255) {
                $alpha = $a / 255.0;
                $r = (int) ($r * $alpha + (1 - $alpha) * $bgR);
                $g = (int) ($g * $alpha + (1 - $alpha) * $bgG);
                $b = (int) ($b * $alpha + (1 - $alpha) * $bgB);
            }

            if ($ignoreColor !== null && $ignoreColor === [$r, $g, $b]) {
                continue;
            }

            $key = "$r,$g,$b";
            if (!isset($colorCounts[$key])) $colorCounts[$key] = 0;
            $colorCounts[$key]++;
        }
    }

    arsort($colorCounts);
    $sorted = array_slice($colorCounts, 0, $numColors, true);
    $total = array_sum($sorted);
    if ($total == 0) dieNice("No colors found");
    $colors = [];
    foreach ($sorted as $rgb => $count) {
        $rgbArr = array_map('intval', explode(",", $rgb));
        $colors[] = [$rgbArr, $count / $total];
    }
    return $colors;
}

/**
 * Write a bar chart as an SVG string.
 *
 * @param array $colors The list of colors and their proportions.
 * @param int $width The width of the SVG.
 * @param int $height The height of the SVG.
 * @param array|null $borderColor The color of the border.
 * @param int $borderWidth The width of the border.
 * @return string The SVG string.
 */
function writeBarSvg(array $colors, int $width, int $height, ?array $borderColor = null, ?int $borderWidth = 0) {
    $isVertical = $width >= $height;

    $svg = ['<?xml version="1.0" encoding="UTF-8"?>'];
    $svg[] = sprintf('<svg xmlns="http://www.w3.org/2000/svg" width="%d" height="%d">', $width, $height);

    $offset = 0;

    foreach ($colors as [$rgb, $fraction]) {
        [$r, $g, $b] = $rgb;

        if (!$isVertical) { // horizontal bars
            $barH = $fraction * $height;
            $svg[] =
                sprintf('<rect x="0" y="%d" width="%d" height="%d" fill="rgb(%d,%d,%d)" />', $offset, $width, $barH, $r, $g, $b);
            $offset += $barH;
        } else { // vertical bars
            $barW = $fraction * $width;
            $svg[] =
                sprintf('<rect x="%d" y="0" width="%d" height="%d" fill="rgb(%d,%d,%d)" />', $offset, $barW, $height, $r, $g, $b);
            $offset += $barW;
        }
    }

    /* ---------- Border ---------- */

    if ($borderColor !== null && $borderWidth > 0) {
        [$br, $bg, $bb] = $borderColor;

        // top
        $svg[] = sprintf(
            '<rect x="0" y="0" width="%d" height="%d" fill="rgb(%d,%d,%d)" />',
            $width, $borderWidth, $br, $bg, $bb
        );
        // bottom
        $svg[] = sprintf(
            '<rect x="0" y="%d" width="%d" height="%d" fill="rgb(%d,%d,%d)" />',
            $height - $borderWidth, $width, $borderWidth, $br, $bg, $bb
        );
        // left
        $svg[] = sprintf(
            '<rect x="0" y="0" width="%d" height="%d" fill="rgb(%d,%d,%d)" />',
            $borderWidth, $height, $br, $bg, $bb
        );
        // right
        $svg[] = sprintf(
            '<rect x="%d" y="0" width="%d" height="%d" fill="rgb(%d,%d,%d)" />',
            $width - $borderWidth, $borderWidth, $height, $br, $bg, $bb
        );
    }

    $svg[] = "</svg>";
    return implode("\n", $svg);
}

/**
 * Write a pie chart as an SVG string.
 *
 * @param array $colors The list of colors and their proportions.
 * @param int $radius The radius of the pie chart.
 * @param array|null $borderColor The color of the border.
 * @param int $borderWidth The width of the border.
 * @return string The SVG string.
 */
function writePieSvg(array $colors, int $radius, ?array $borderColor = null, ?int $borderWidth = 0): string
{
    $wh = $radius * 2;
    $cx = $cy = $radius;
    // Adjust the radius if a border is added
    if ($borderColor !== null && $borderWidth > 0) {
        $radius -= $borderWidth;
    }

    $svg = ["<?xml version=\"1.0\" encoding=\"UTF-8\"?>"];
    $svg[] = "<svg xmlns=\"http://www.w3.org/2000/svg\" width=\"$wh\" height=\"$wh\">";

    $currentAngle = 0;

    foreach ($colors as $slice) {
        [$r, $g, $b] = $slice[0];
        $proportion = $slice[1];

        $sliceAngle = $proportion * 360;

        // Convert to radians
        $start = deg2rad($currentAngle);
        $end   = deg2rad($currentAngle + $sliceAngle);

        // Start and end points on the arc
        $x1 = $cx + $radius * cos($start);
        $y1 = $cy + $radius * sin($start);
        $x2 = $cx + $radius * cos($end);
        $y2 = $cy + $radius * sin($end);

        // Large arc flag
        $largeArc = ($sliceAngle > 180) ? 1 : 0;

        $svg[] = sprintf(
            '<path d="M %f %f L %f %f A %f %f 0 %d 1 %f %f Z" fill="rgb(%d,%d,%d)"/>',
            $cx, $cy,  // Move to center, then line to start
            $x1, $y1,
            $radius, $radius,
            $largeArc,
            $x2, $y2,
            $r, $g, $b
        );

        $currentAngle += $sliceAngle;
    }

    /* ---------- Optional Border (Circle Stroke) ---------- */
    if ($borderColor !== null && $borderWidth > 0) {
        [$br, $bg, $bb] = $borderColor;

        $svg[] = sprintf(
            '<circle cx="%f" cy="%f" r="%f" fill="none" stroke="rgb(%d,%d,%d)" stroke-width="%d"/>',
            $cx,
            $cy,
            $radius,
            $br, $bg, $bb,
            $borderWidth
        );
    }

    $svg[] = "</svg>";
    return implode("\n", $svg);
}
The web page contains the controls that the Python script gets set with the cli arguments. The analyzing of the image file and writing the SVG is done with the PHP version that does pretty much the same as the Python script.
Credits to the flag images
The original flag images are taken from the german Wikipedia. Credits go to:
- Czech Republic - Von Jaroslav Kursa - Appendix No. 3 of Czech Legal Act 3/1993, Gemeinfrei, Link
- Portugal - Von Original: Columbano Bordalo Pinheiro Vektor: Vítor Luís Rodrigues, António Martins-Tuválkin - Símbolos Nacionais, Gemeinfrei, Link
- Ireland - Von Éire - Drawn by User:SKopp, Gemeinfrei, Link